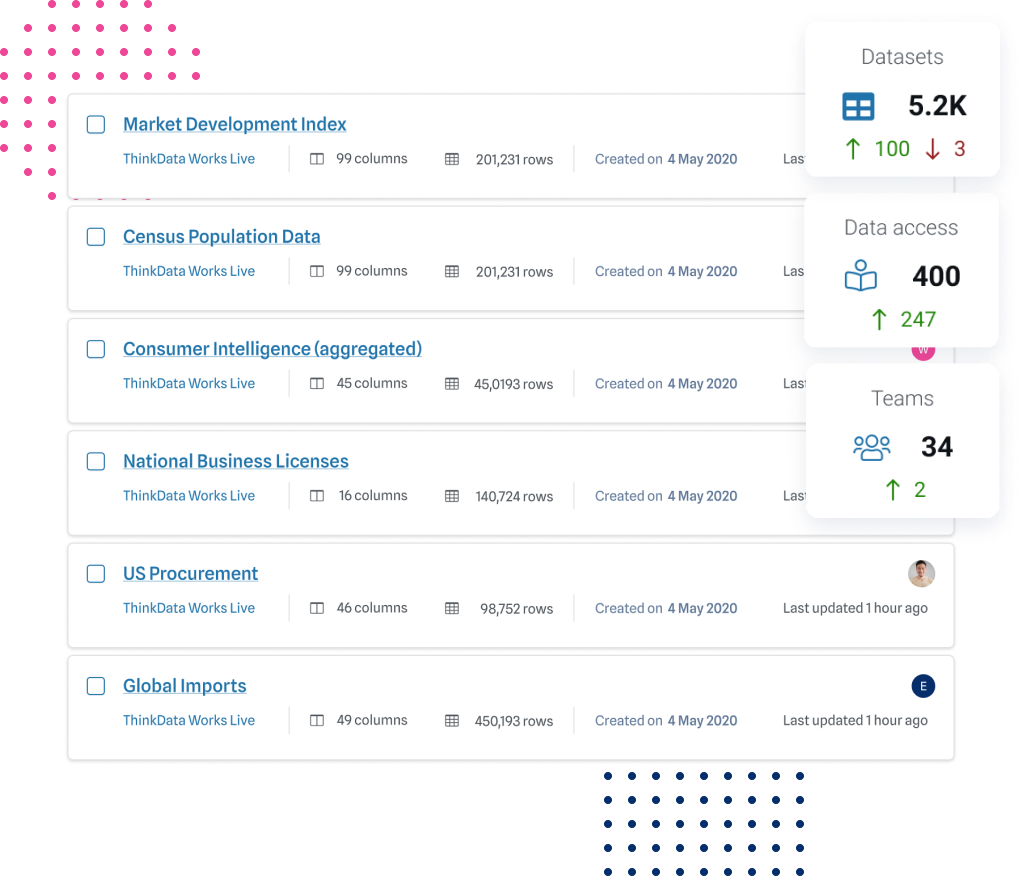
See changes over time
Data is dynamic — it evolves, changes shape, and grows. See its evolution on a timeline to understand its overall health.
Get insights and alerts to make sure you can depend on data. Your business runs on data — keep it running with confidence.
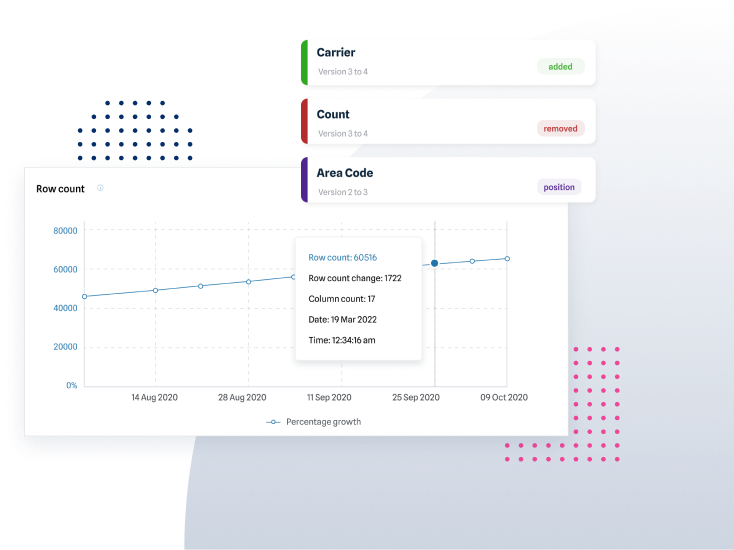
Data is dynamic — it evolves, changes shape, and grows. See its evolution on a timeline to understand its overall health.
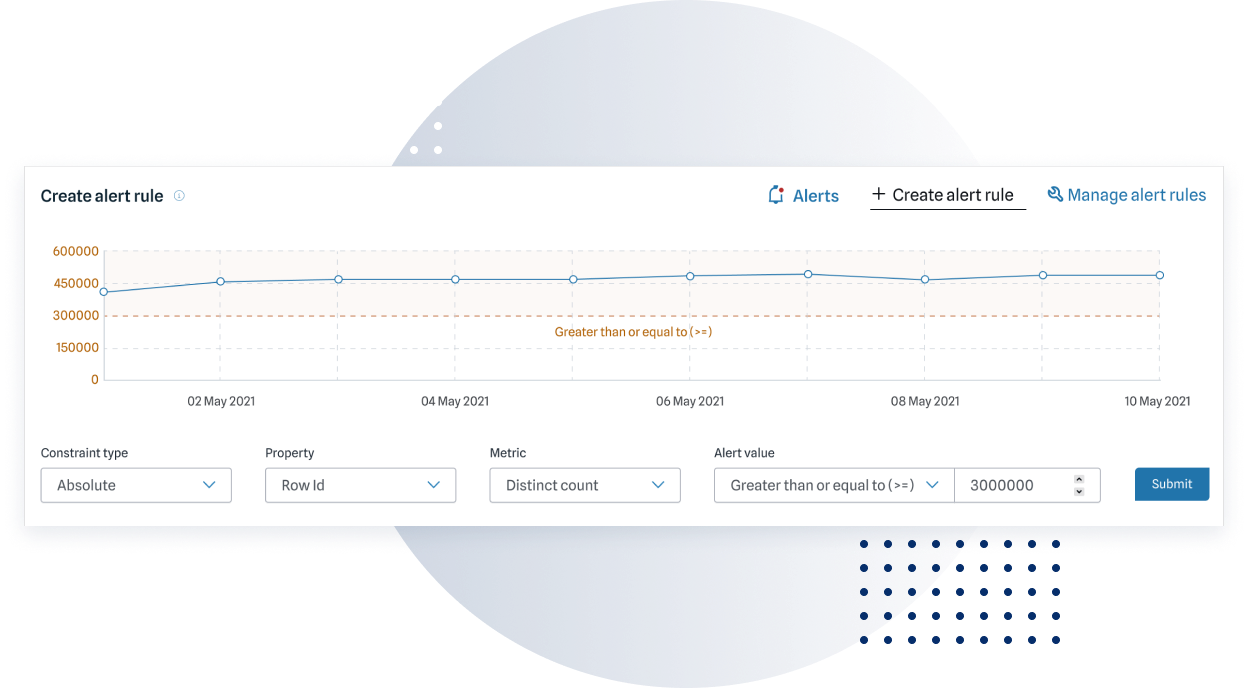
Small errors have big consequences. Get peace of mind: custom alerts notify you when values fall out of their expected range.
Data observability is more than row and column counts. Our connected dashboard delivers health metrics on every data point.
Empower users to understand data quality at a glance with easy-to-use data score cards and intuitive drill-downs into data utility, heath, and activity.
$15M
75%
Data professionals shine when they’re building data-fuelled solutions, but they spend as much as 80% of their time in data cleaning, data preparation, and verifying dataset health.
Tracking changes on updates means rerunning several manual processes. For high-velocity data with frequent updates, managing data quality becomes a full-time job.
Ensure your team can track data changes, no matter their magnitude. Get visibility on new columns, null values, and more at the click of a button.
One mistake in a dataset update can erode trust in your data products; if you distribute data, you need a way to ensure that it is up-to-date and accurate, always.
We take data health seriously. Whether you need powerful tools to track data health, or the expert advice of a company that runs on data, book a consultation with us today.
See how easy it is to look under the hood at the information you depend on
Crafting an alert is simple, even if your logic needs to be complex.
See the data at a glance: changes to columns, row counts, and more.
Fine details for power users who need to know the data inside and out.
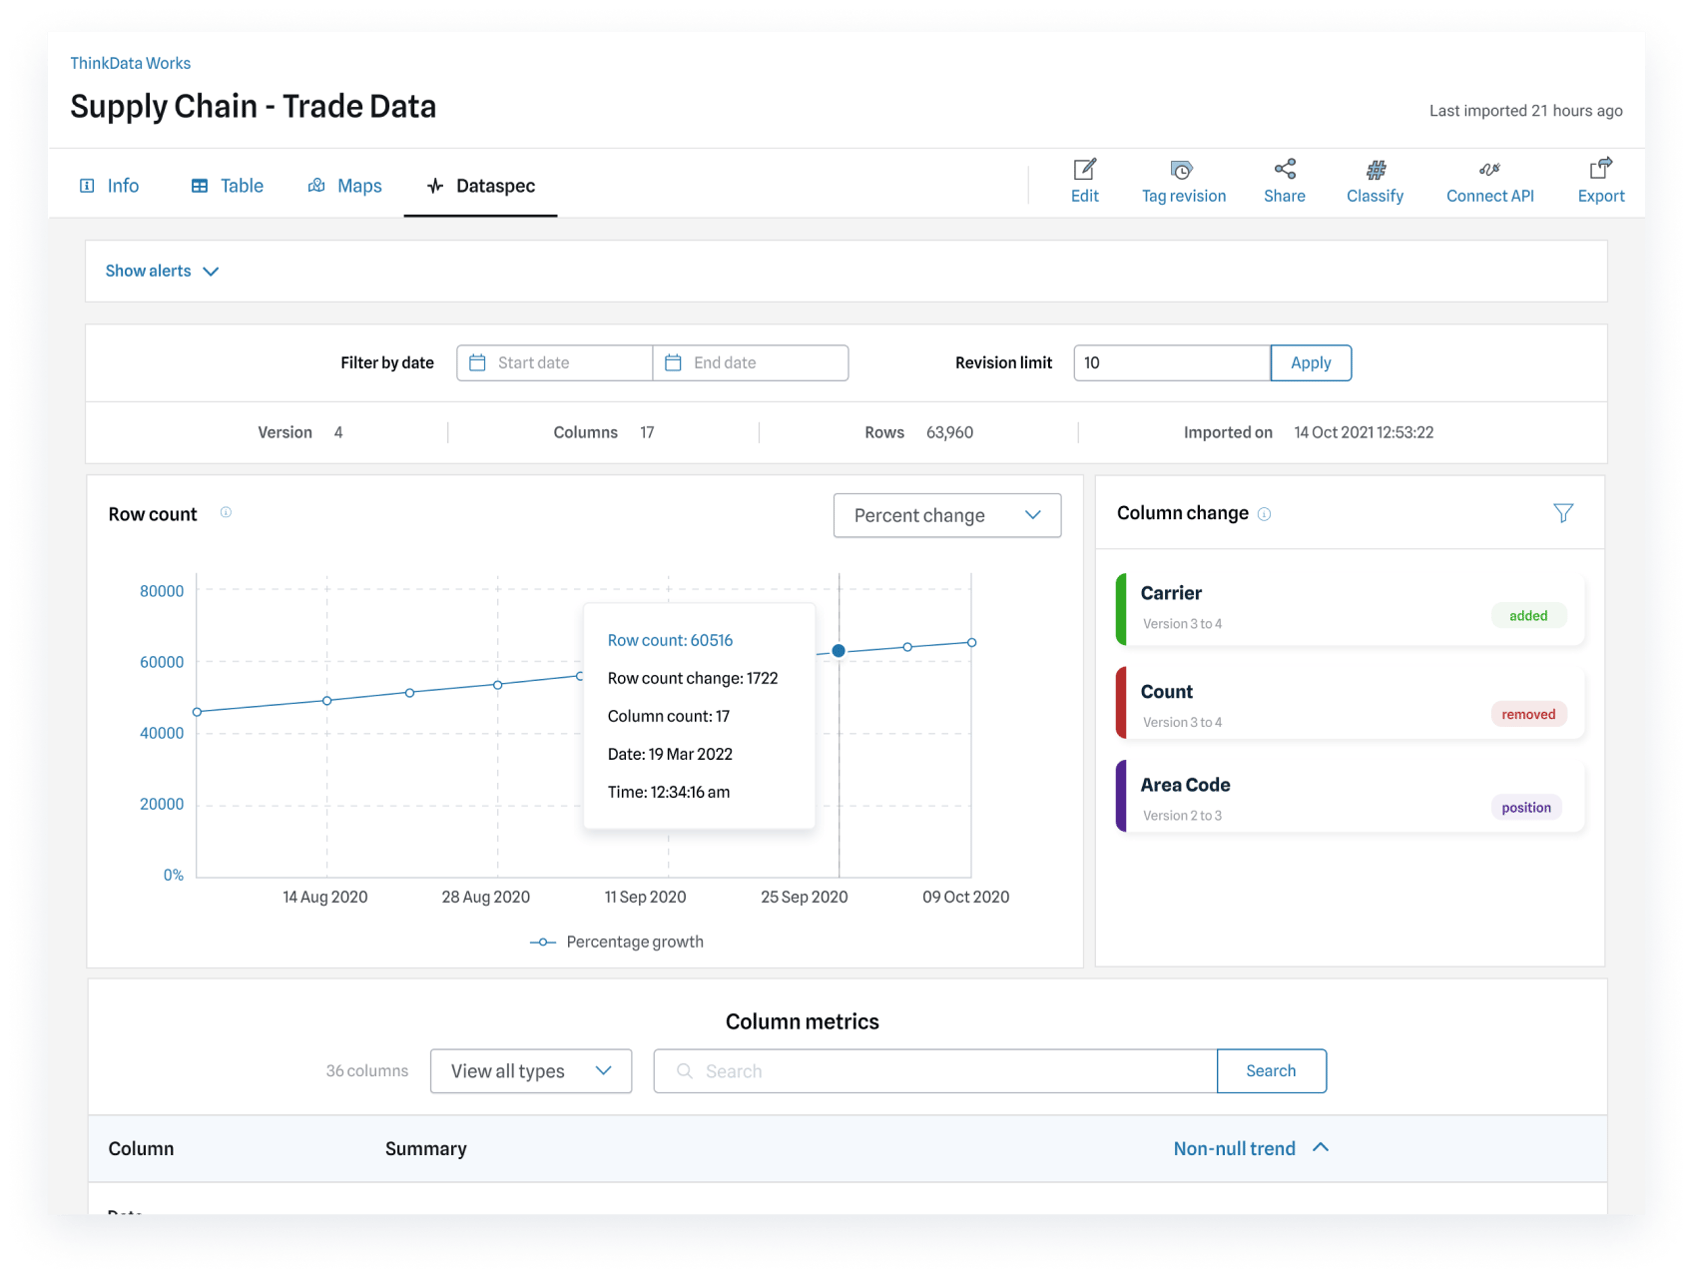
ThinkData Works unlocks rapid and simplified access to health metrics that make it easy for anyone on your team to understand.
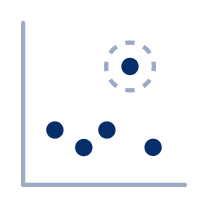
Spot errors, not problems: when data deliveries count on quality, you need observability integrated into your catalog.
Help your data team become a well-oiled machine — improve both project outcomes and time-to-market.
Data observability is just one piece of the puzzle, and just one of the many solutions we offer. Reach out to us to book a demo to see our end-to-end platform.
